


LTI, MTTR, and MTBF – three letter combinations that sound like spreadsheets and Excel, but in reality, they make the difference between a predictable fleet and costly downtime. Whether it's a work platform, forklift, or construction equipment – understanding these metrics means you have a true grip on safety, reliability, and efficiency.
Why these metrics are important
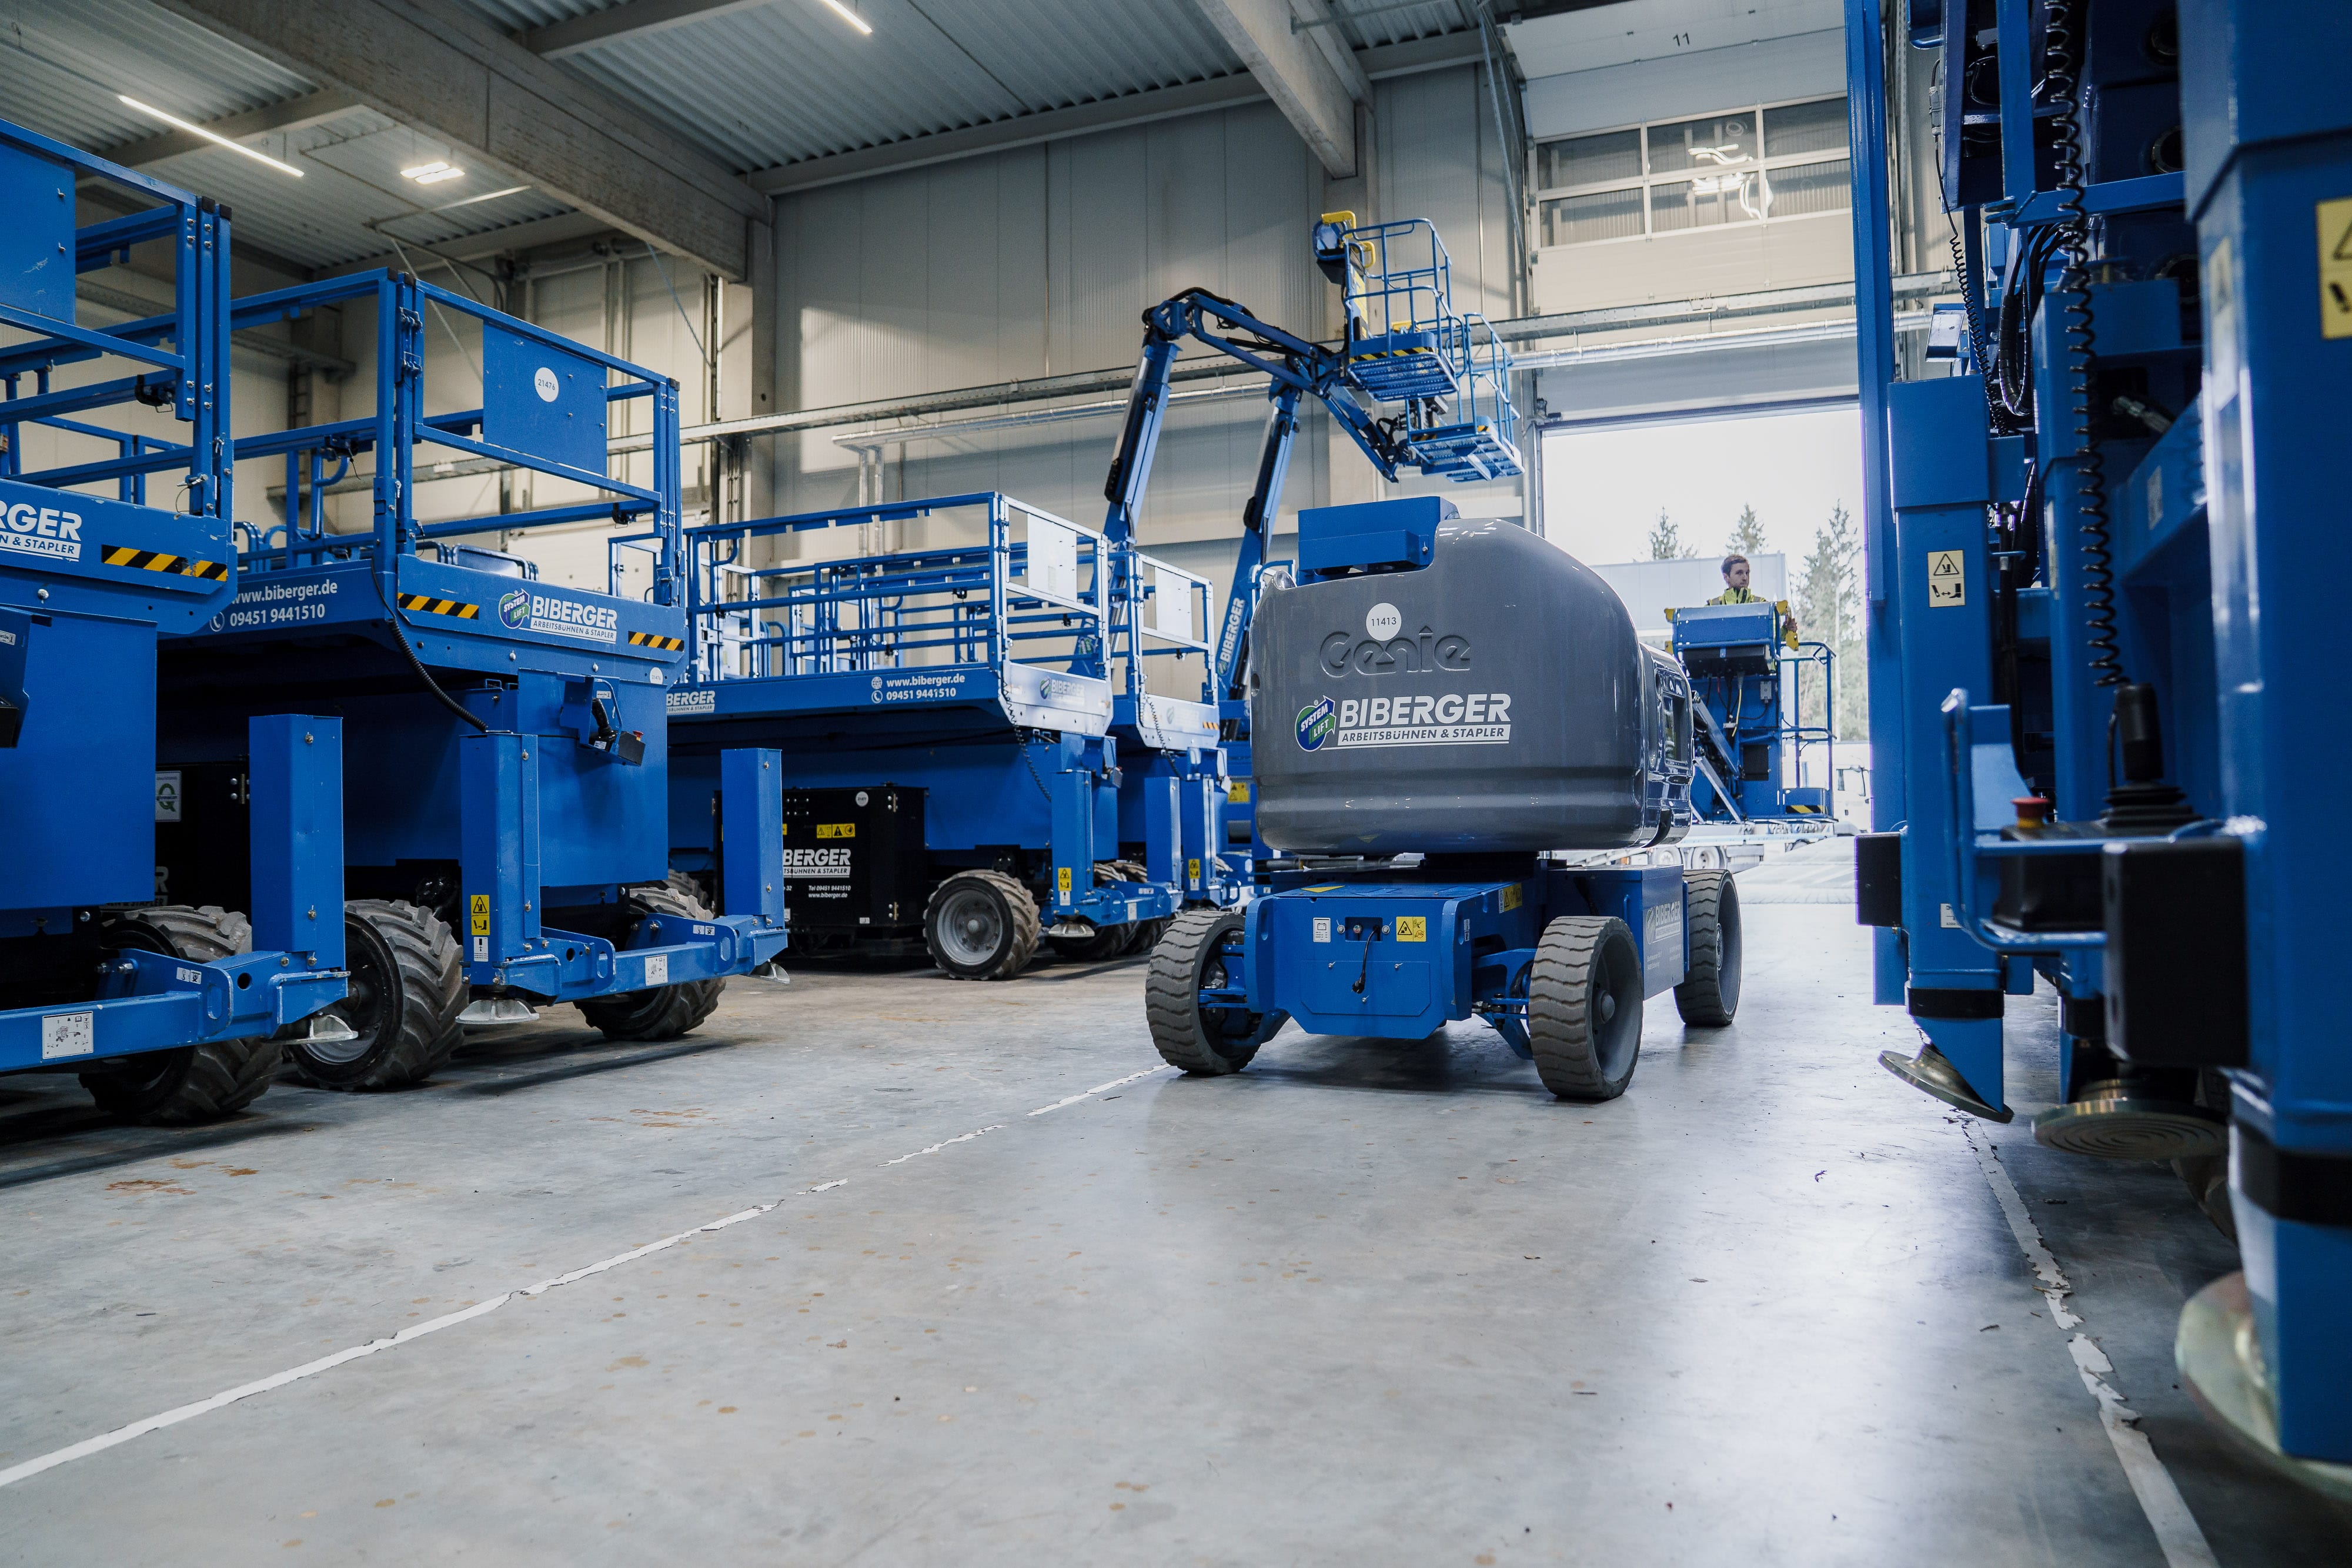
In rental and daily fleet operations, it's not just how many devices are out there that count, but how smoothly they run. A technical failure or accident quickly becomes costly – both financially and in terms of customer trust. With LTI , MTTR , and MTBF, you can make this measurable: less gut feeling, more facts.
The three most important security KPIs at a glance
LTI / LTIFR – Lost Time Injury (Frequency Rate)
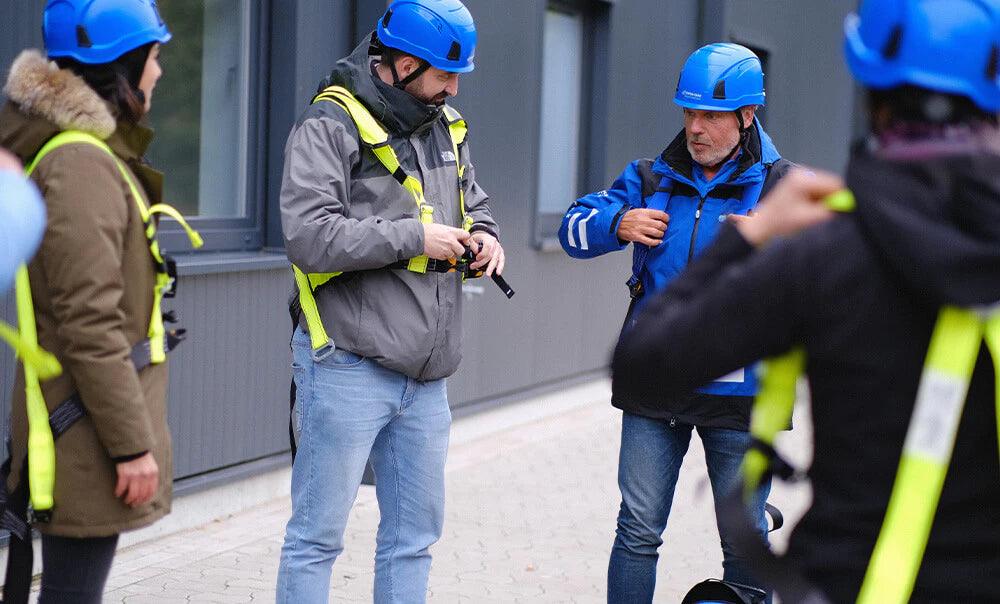
The LTI indicator describes lost-time accidents. If a mechanic, driver, or operator misses at least one shift after an accident, this counts as an LTI. The LTIFR (Lost Time Injury Frequency Rate) shows how often such accidents occur per working hour.
Formula:
LTIFR = (number of LTI / hours worked) × 200,000
Example: An accident in 40,000 working hours results in an LTIFR of 5 – this is the benchmark to see whether training, PPE use and safety culture are working or have gaps.
MTTR – Mean Time to Repair
MTTR measures the time it takes for a defective device to be back up and running. The lower this value, the better the internal organization. This shows whether the service is functioning properly – spare parts in stock, customer communication prompt, and technicians on call.
Formula:
MTTR = Total repair time ÷ Number of repairs
Example: A scissor lift breaks down because a control cable is defective. The repair takes 1.5 hours – that's great. In many companies, anything under 2 hours is great. Anything longer than that quickly becomes expensive because the lift is stationary and the customer is waiting.
MTBF – Mean Time Between Failures
While MTTR focuses on response time, MTBF indicates technical reliability—that is, how many operating hours a machine can last on average without failure. A true quality indicator, especially in the rental business.
Formula:
MTBF = Total operating time ÷ Number of failures
For example, if a forklift experiences a breakdown every 600 hours, the MTBF is 600. The higher the better. Premium trucks often last 800–1,000 hours or more—this directly contributes to customer satisfaction.
How the key figures work together in practice
| KPI | What is being measured? | Practical example | Meaning |
|---|---|---|---|
| LTI / LTIFR | Work-related accidents with lost time | 1 accident per 40,000 hours → LTIFR 5 | Safety level in operation |
| MTTR | Average repair time | 1.5 hours per case | Efficiency in service |
| MTBF | Time between two failures | 600 operating hours | Reliability of the devices |
Other useful key figures in everyday fleet operations
- OEE (Overall Equipment Effectiveness): combines availability, performance and quality.
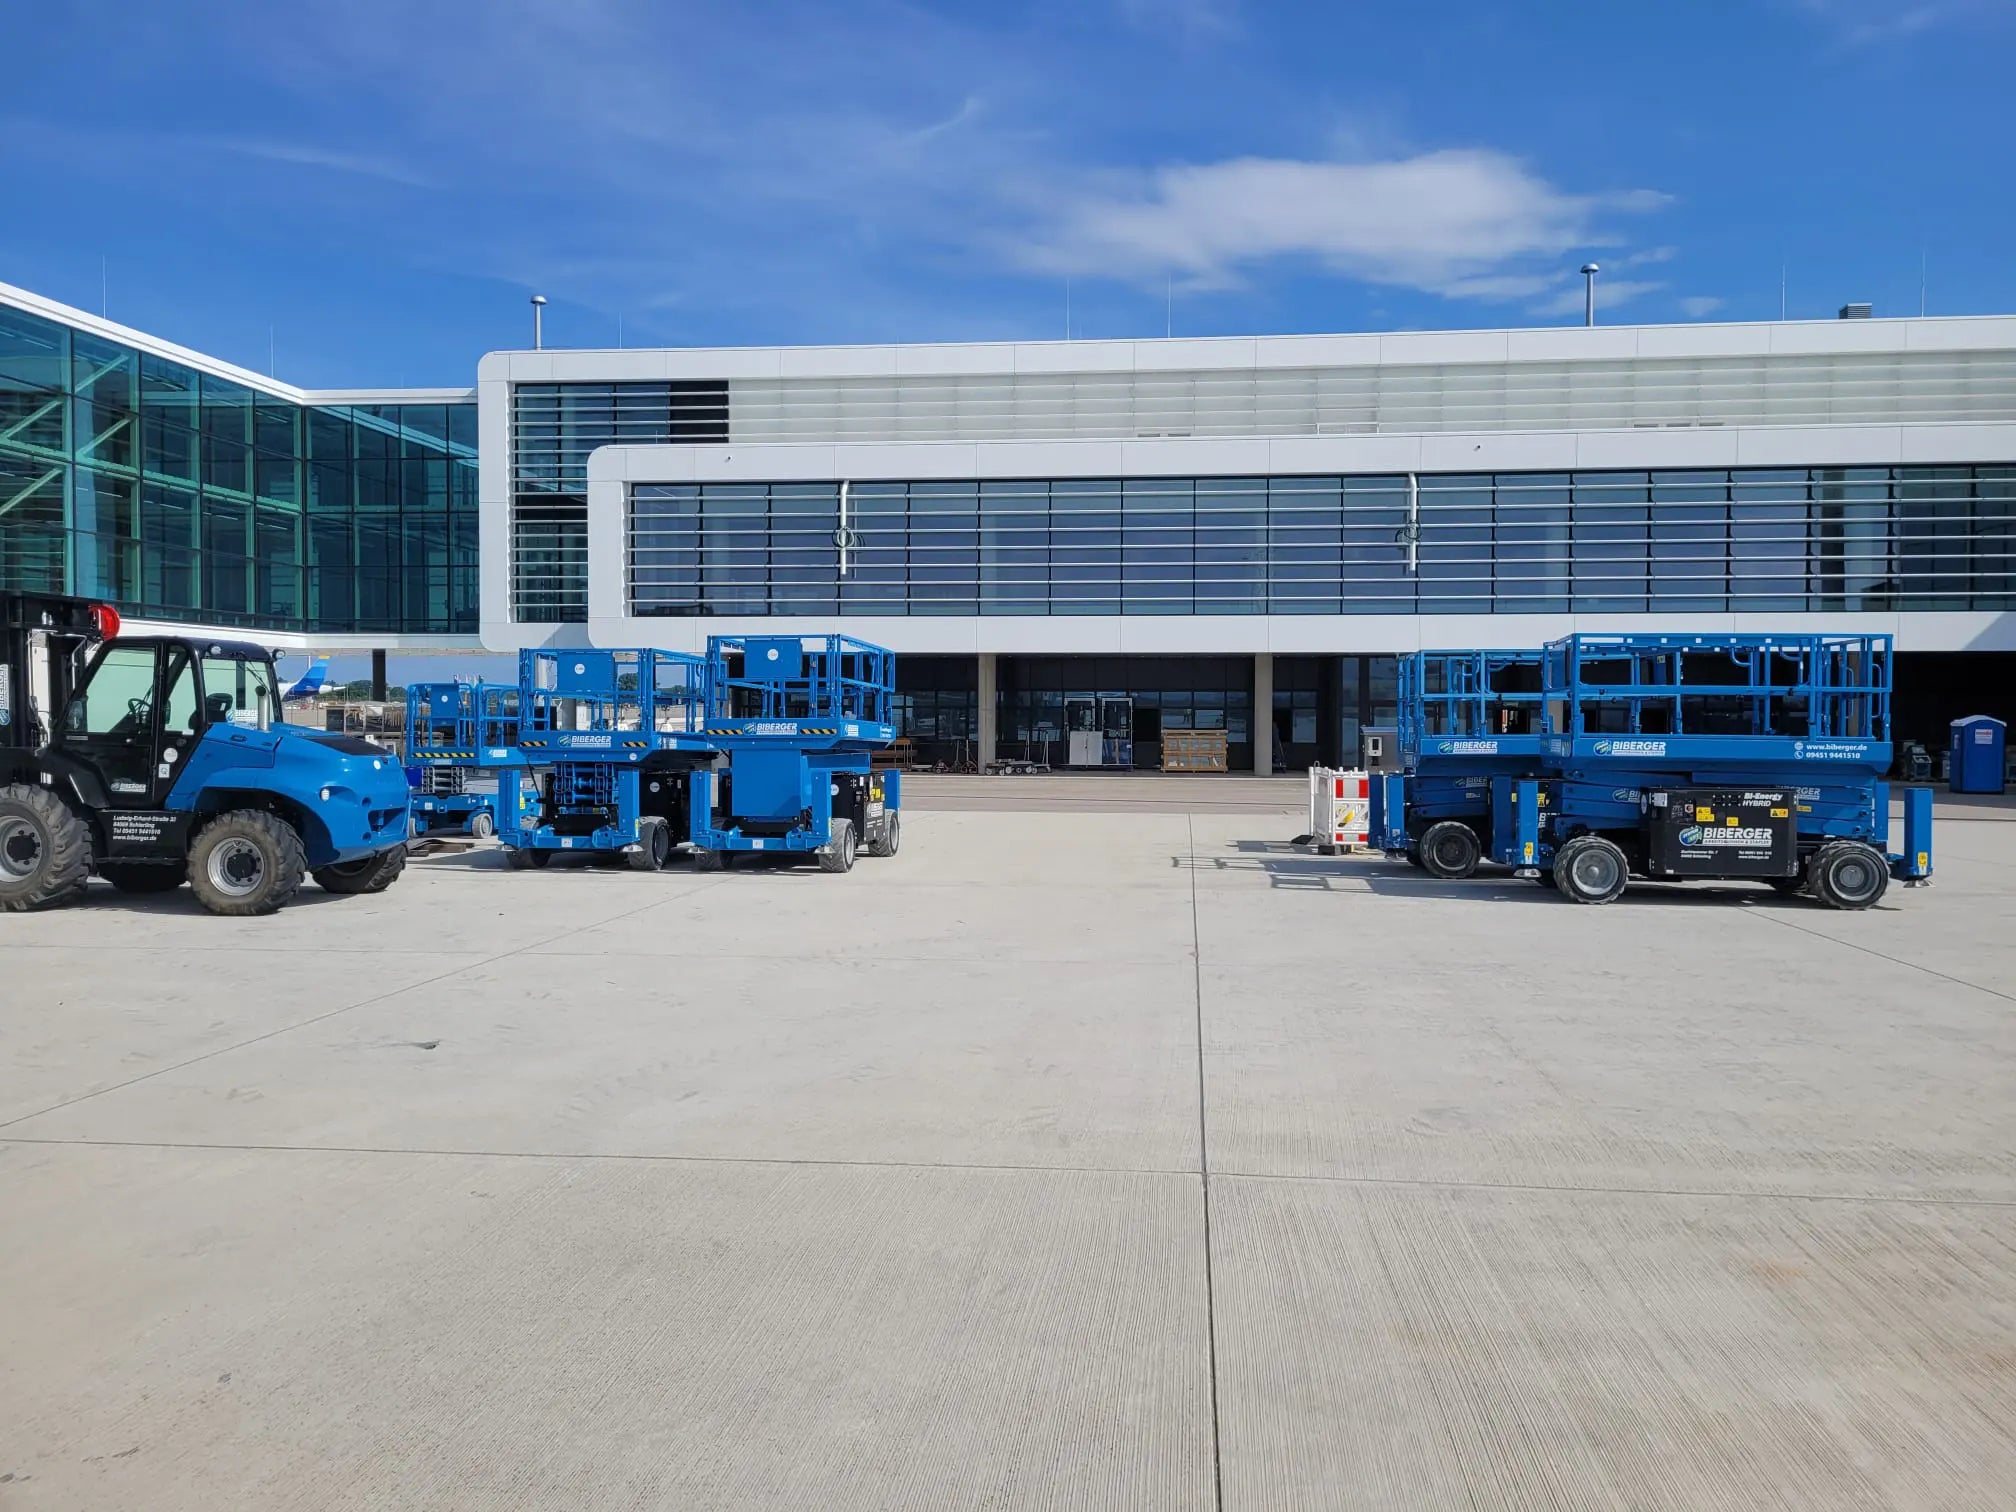
- Availability (%): shows how often devices are actually ready for use.
- Maintenance backlog: open service or inspection orders in relation to the total inventory.
- FFZ-KPI: specifically for forklift fleets – measures utilization, crash rate, and energy efficiency.
How to really use the key figures in everyday life
1. Think reactively AND proactively
Reactive indicators show what happened—accidents, downtimes, and failures. Proactive indicators show what was prevented—training, checks, maintenance, and safety meetings. Only the combination of both approaches provides a comprehensive safety picture. This way, you not only identify problems, but also identify areas where you're already making significant progress.
2. Don’t just collect data – understand it
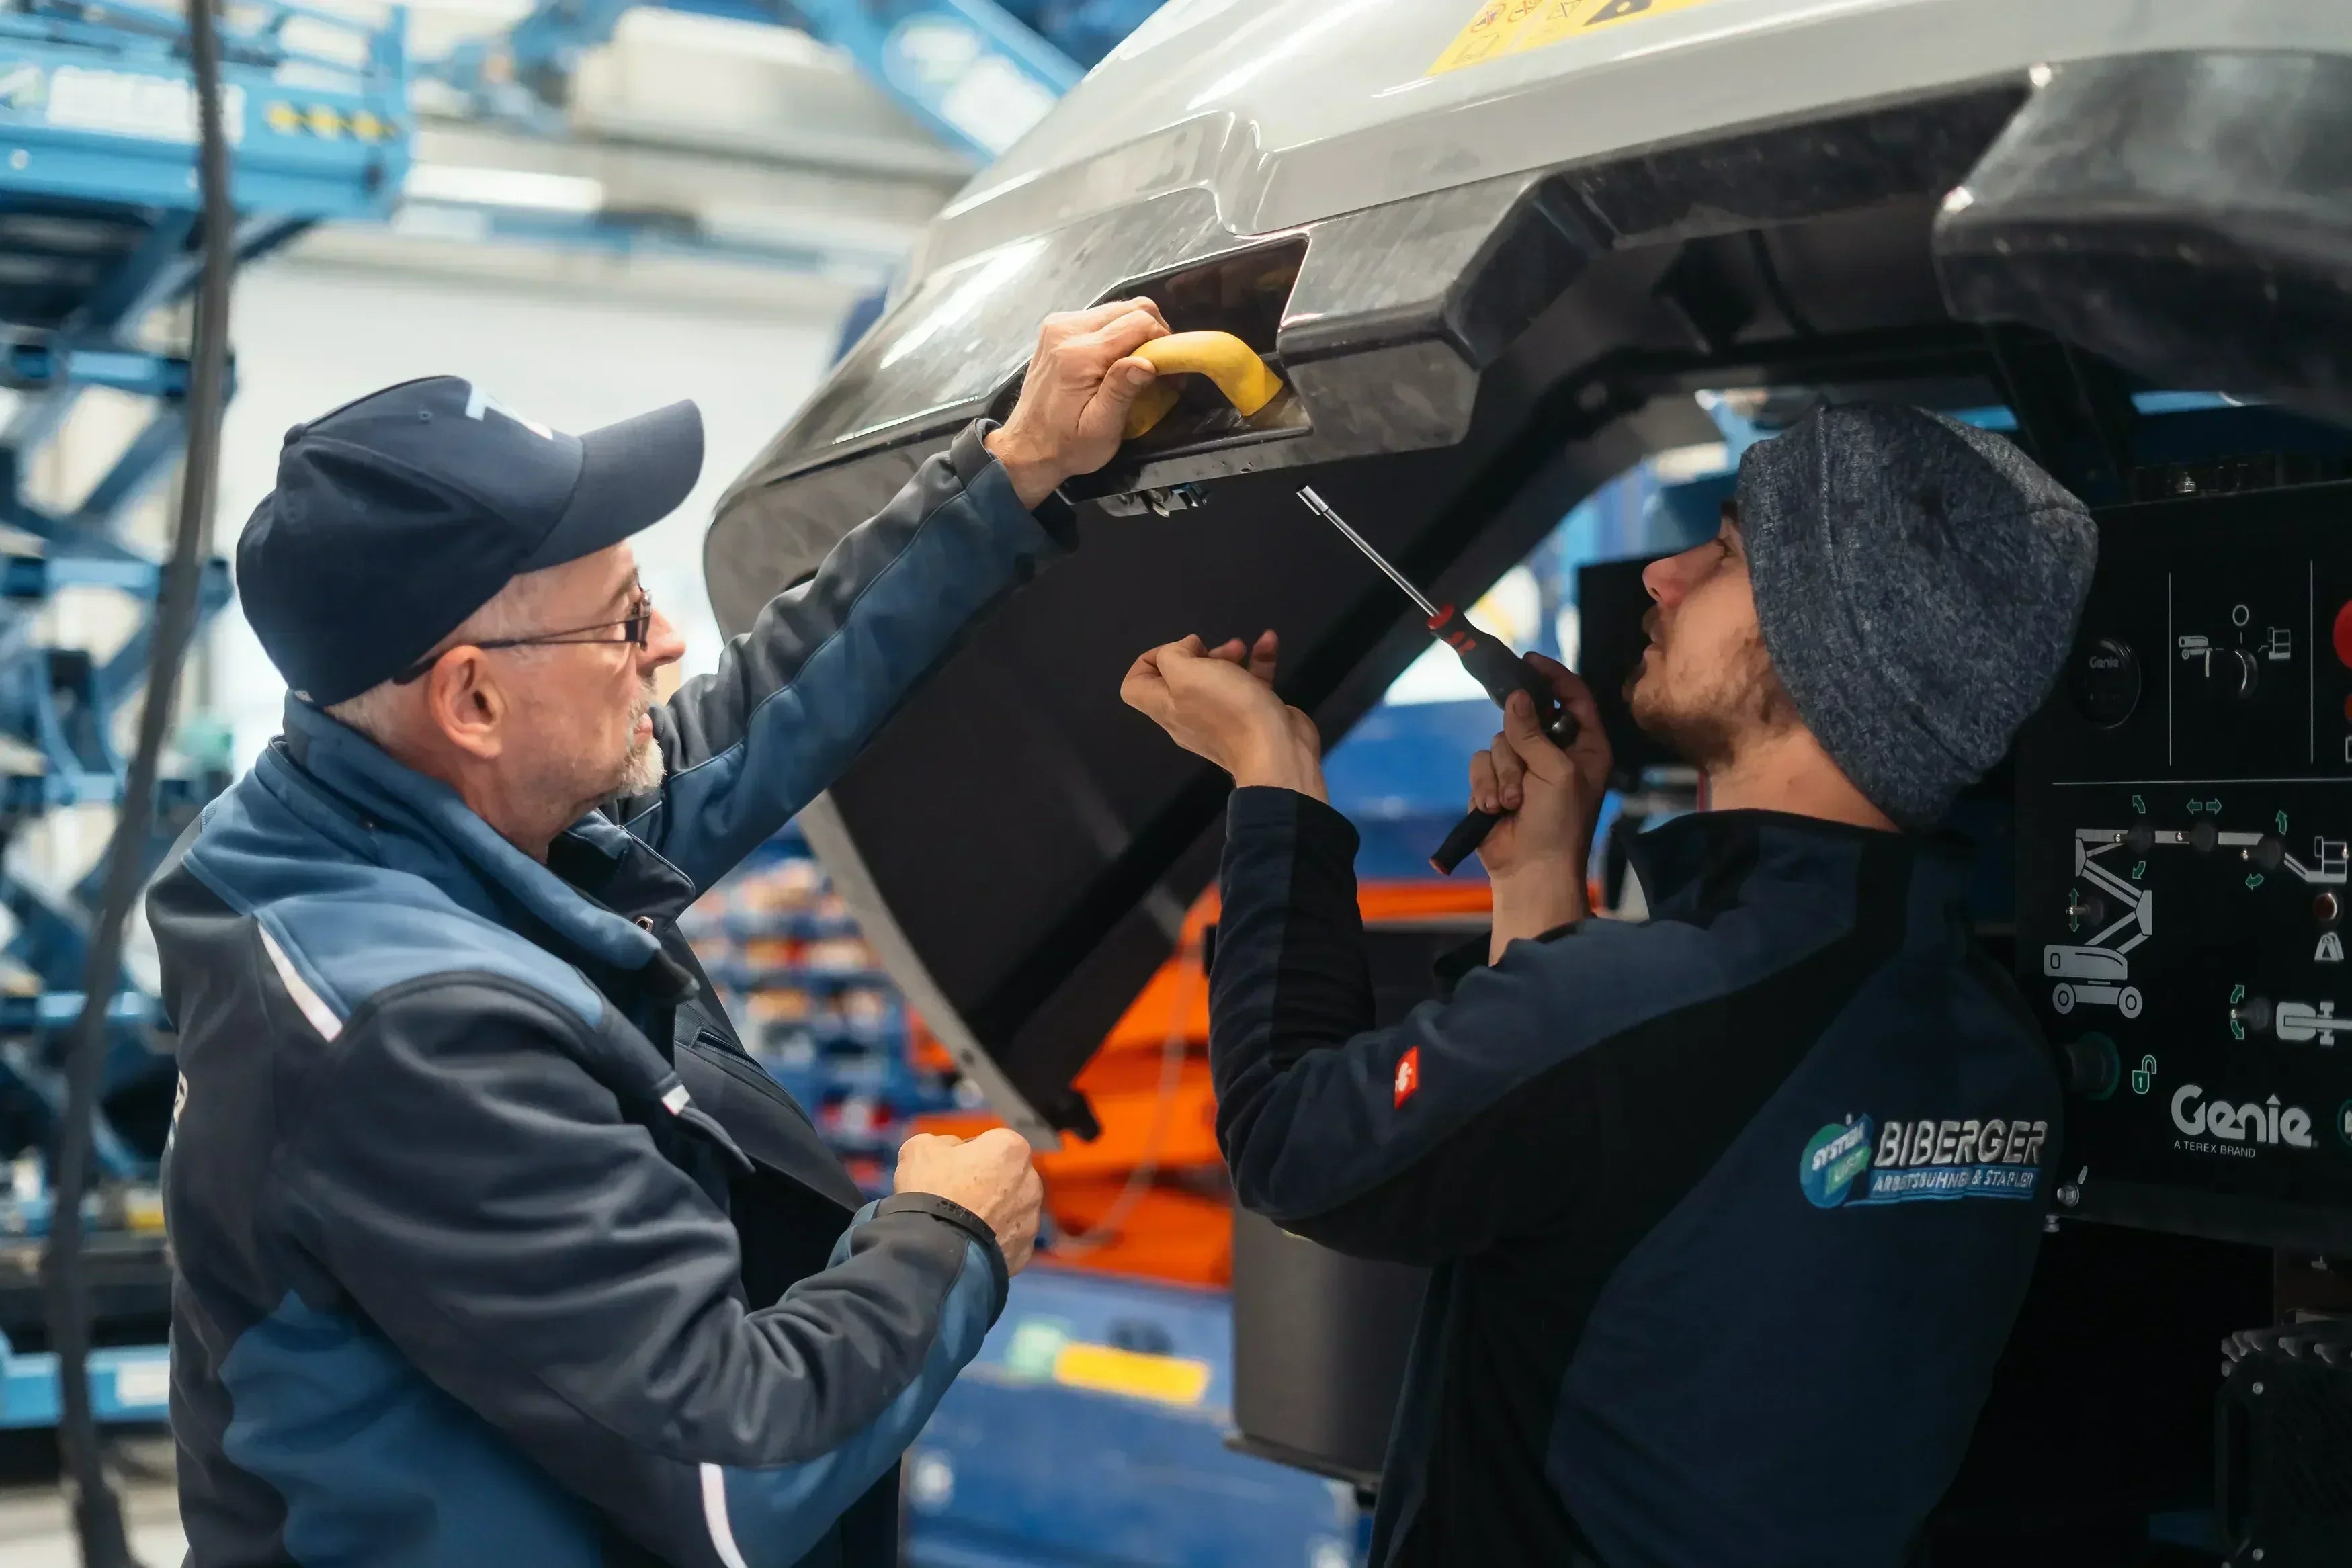
Numbers alone are of little use if no one reads them. At BIBERGER, we use KPIs to identify patterns: Which devices fail more frequently? Which worksites generate the most repairs? When do failures occur most frequently—before or after service? This is how statistics become real management.
Software tools and digital evaluation
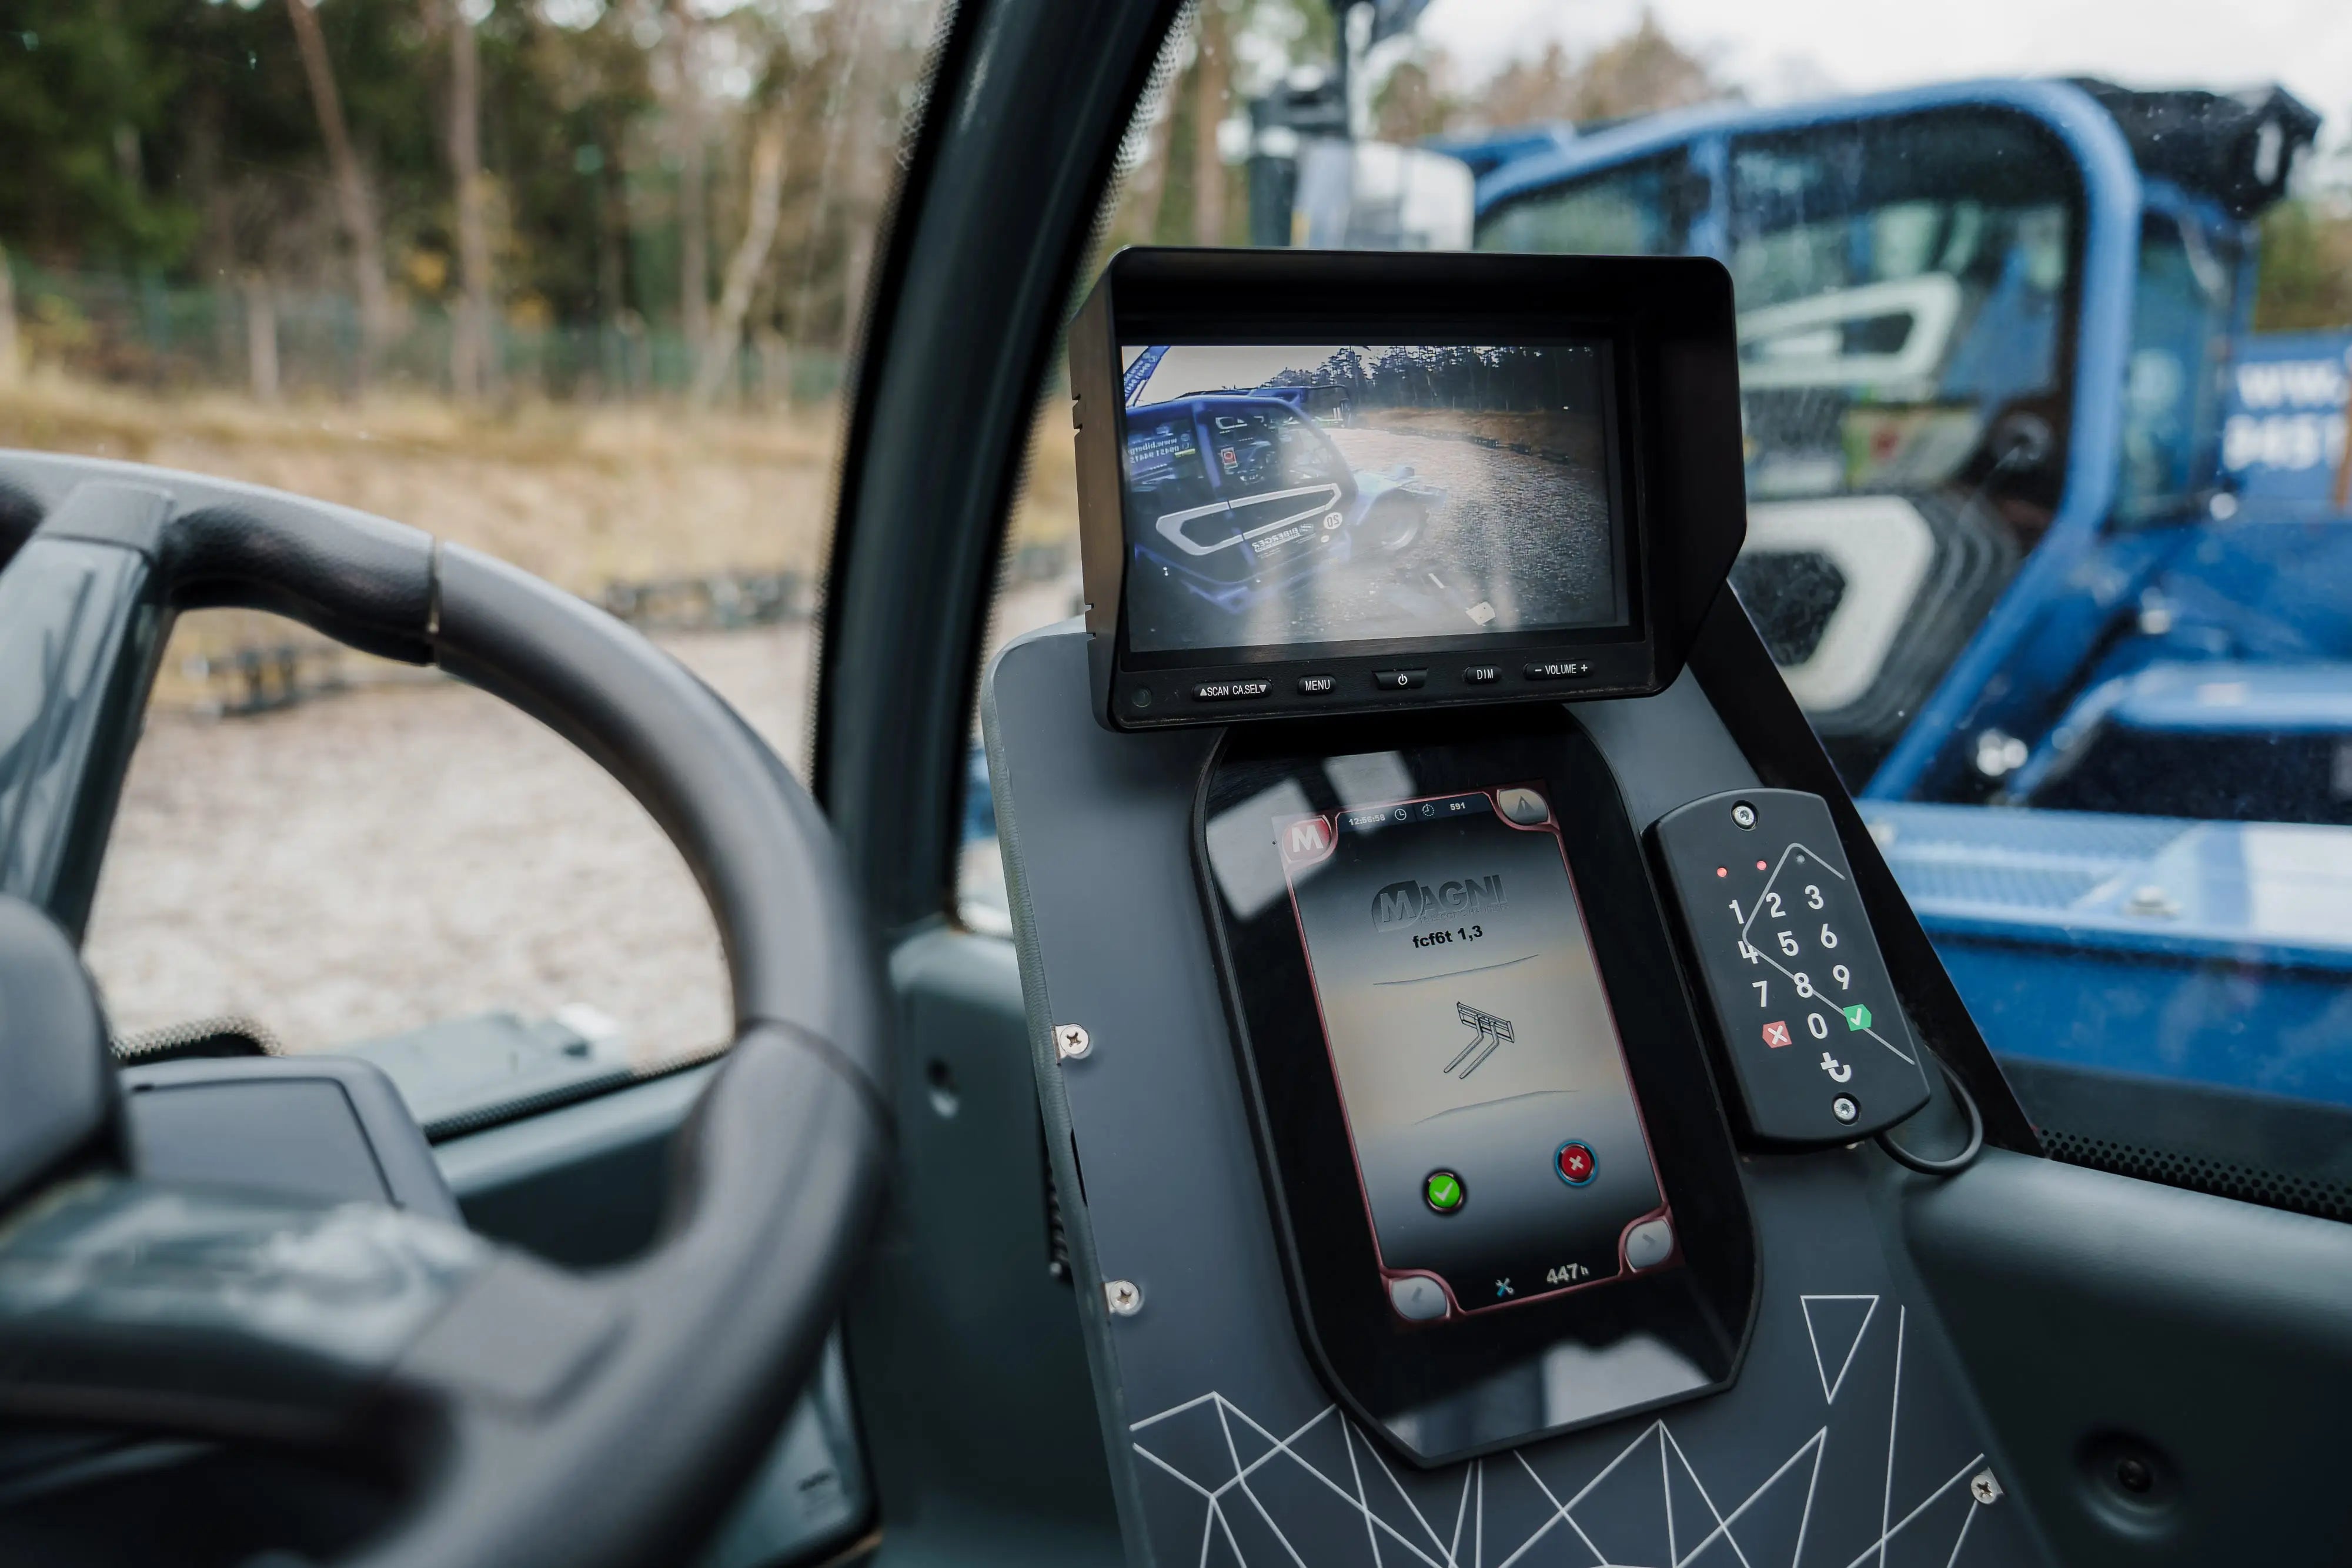
Digital fleet management systems are a real game changer here. They automatically record operating times, breakdowns, and maintenance intervals, linking them to orders or operator data. This allows trends to be identified early: Is the MTBF decreasing for certain models? Is the MTTR slowing down due to a lack of spare parts? Good tools can visualize this – as a dashboard, traffic light system, or KPI report. Some providers even offer direct integration with rental systems, so that data from platforms or forklifts automatically flows into the service calendar. This saves paper, time, and stress.
Case Studies: When Key Performance Indicators Save Money
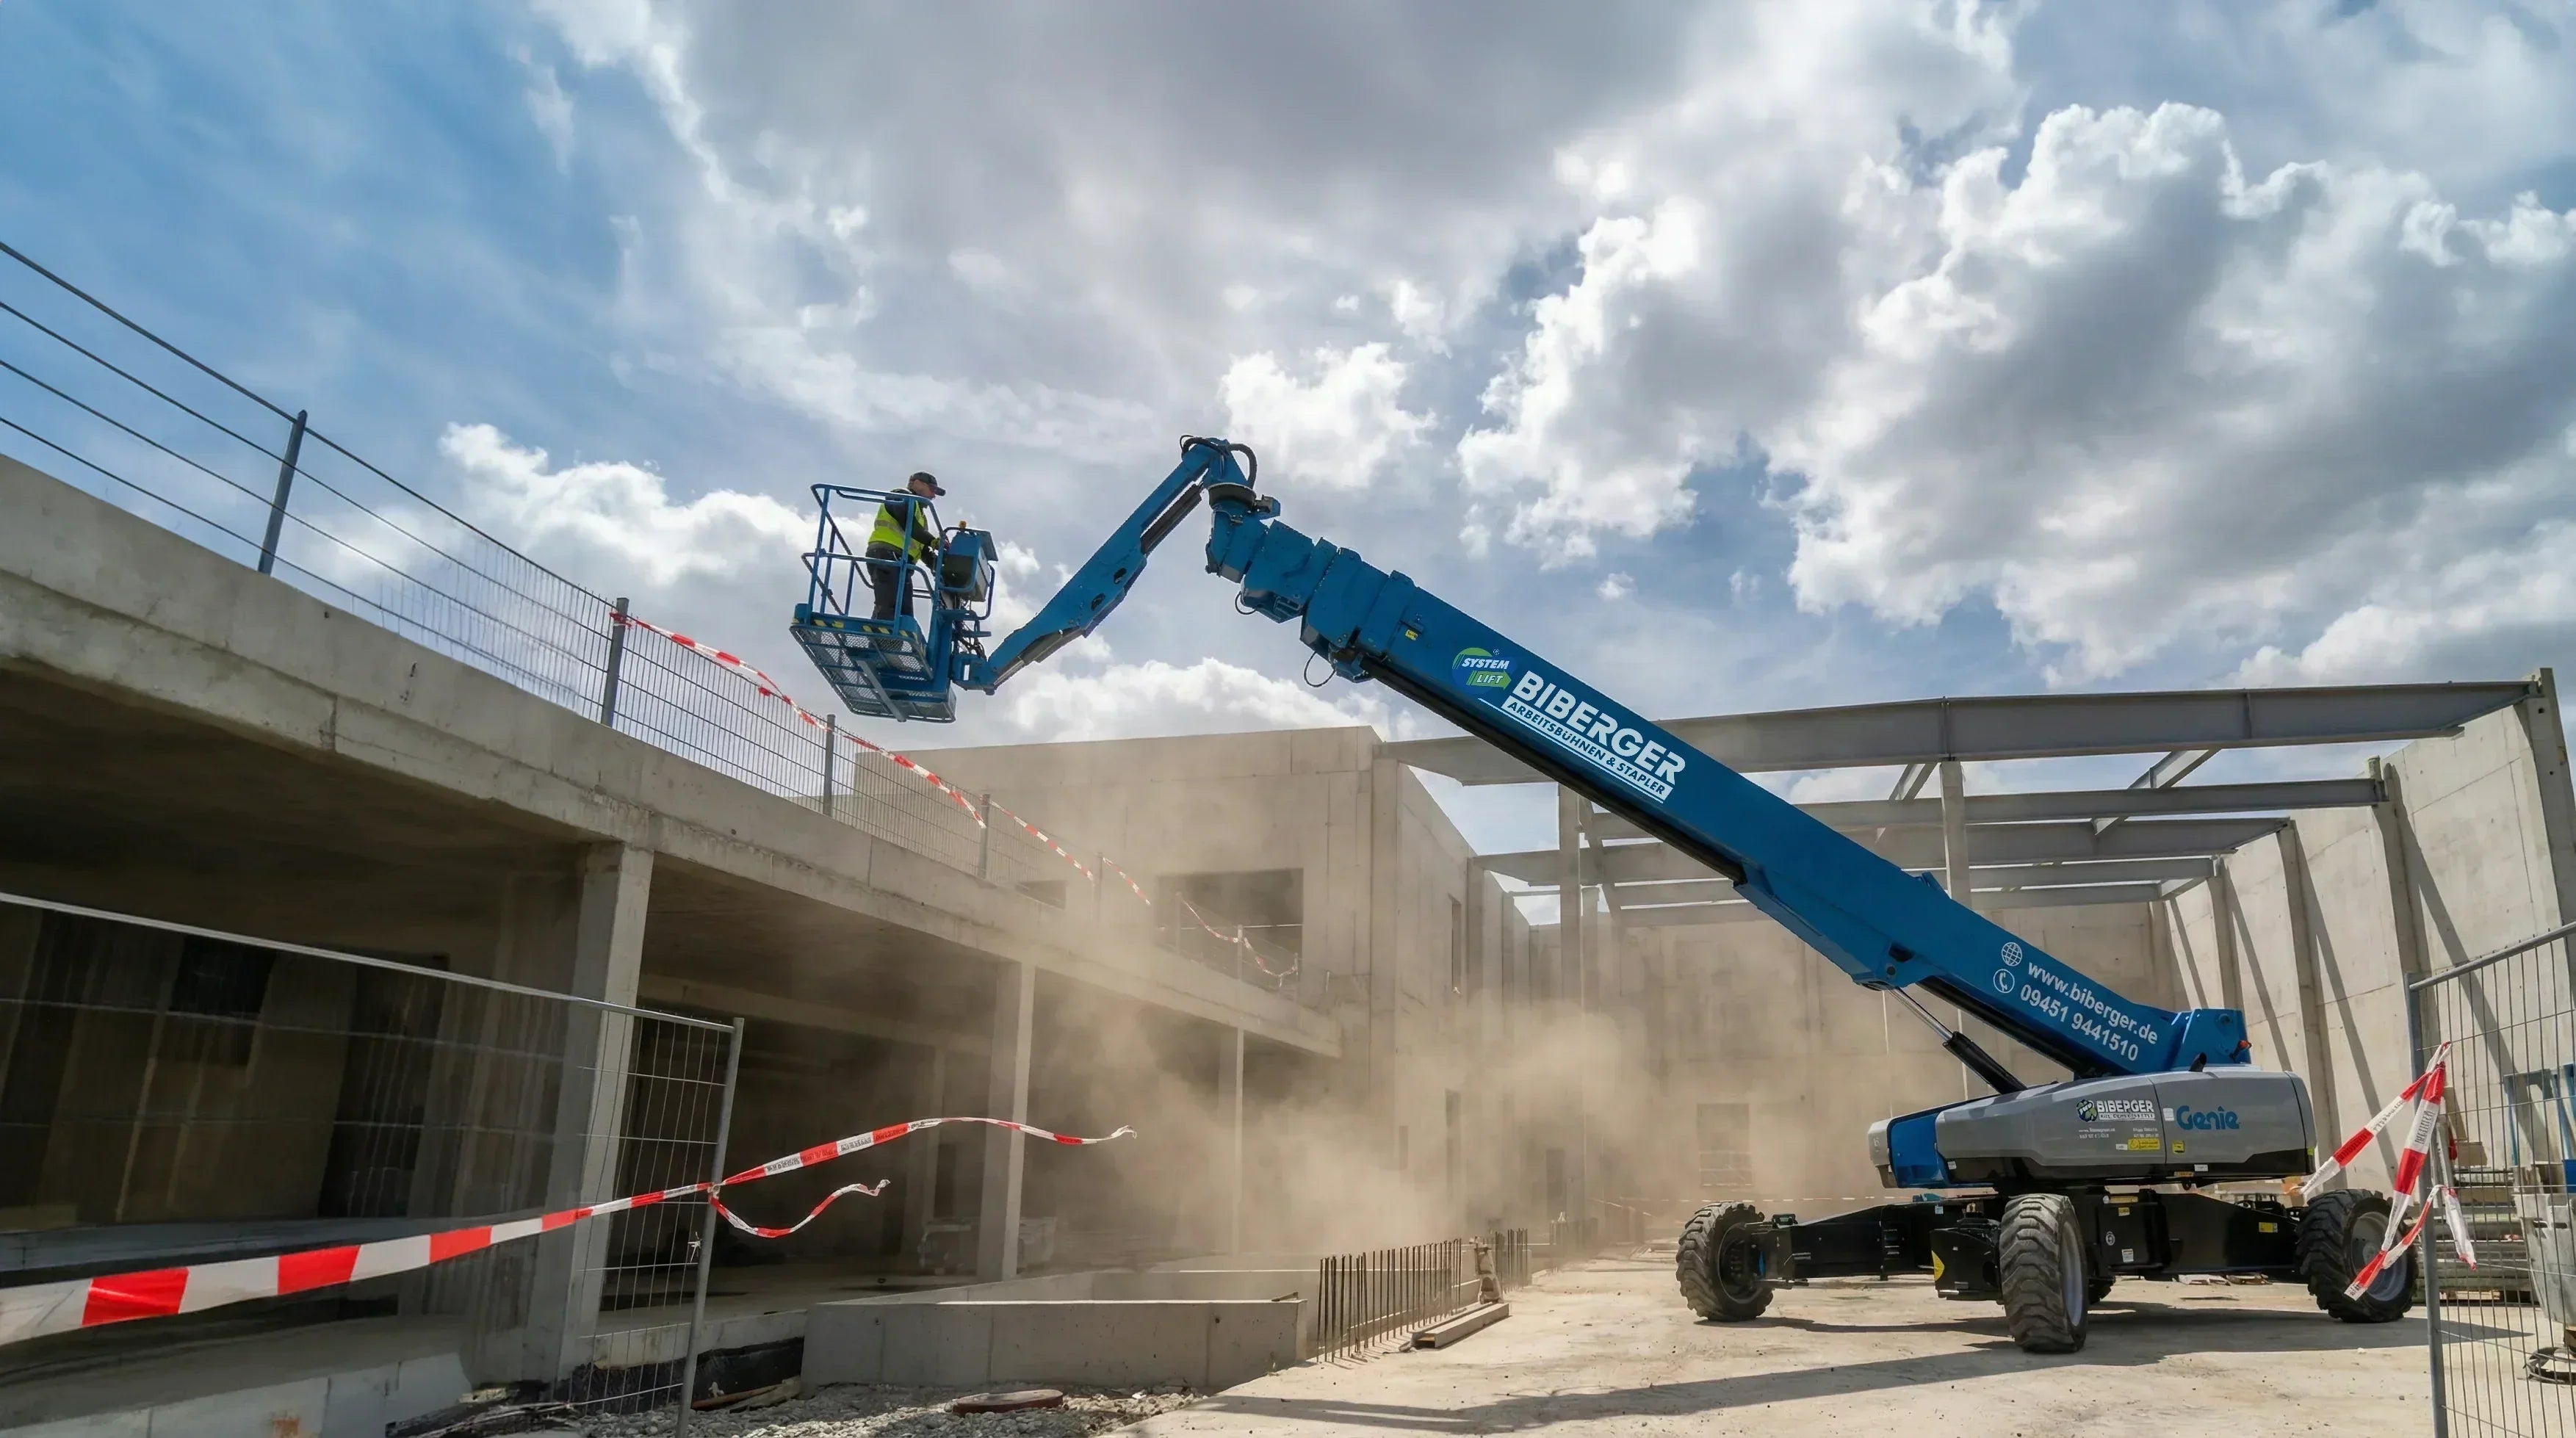
Example 1 – Telescopic boom lift fleet: As a rental company, we noticed through our analysis that MTTR values for certain models were twice as high as the average. The reason: spare parts were not in stock. After switching to central parts storage, the MTTR dropped from 4.5 to 1.8 hours – saving around 120 hours of downtime per year.
Example 2 – Forklifts in continuous use: An industrial customer compares MTBF values and realizes that the most frequently used machines fail more frequently. By adjusting service intervals and providing driver training, the MTBF increases by 35%. Fewer breakdowns, less hassle, and less costs.
Cost/benefit analysis: Is it really worth it?
Yes, definitely. Accurate KPI analysis saves money. If you know where equipment is failing, you can adjust service plans specifically, prevent breakdowns, and reduce replacement costs. For example, a single rented stage that's out of service for two days due to a maintenance backlog can cost several hundred euros in revenue. With regular MTBF/MTTR monitoring, such downtimes can be drastically reduced.
ROI example: Costs for monitoring systems: approx. €200 per device/year.
Saved downtime costs: approx. €1,000 – €1,500 per year.
→ ROI often achieved in the first year.
Recommendations for practice
- Evaluate all KPIs regularly – ideally per quarter or deployment type.
- Display values visually (traffic light systems or trend curves).
- Actively use MTTR and MTBF in customer discussions – they demonstrate professionalism.
- Discuss results with service, scheduling, and technology. Numbers are teamwork.
Conclusion
KPIs aren't just a number game, they're a tool for keeping safety, service, and profitability under control. Those who take LTI, MTTR, and MTBF seriously not only work more efficiently, but also more safely. At BIBERGER , we use precisely these metrics to continuously improve maintenance, scheduling, and customer satisfaction – so that every platform and every forklift truck runs when it counts.


Share:
DGUV regulations and principles for work platforms and forklifts – simply explained
Top 10 work platforms 2025/2026 – Our recommendations from rental practice
Our editorial quality standards
The subject content on biberger.de are editorially created, reviewed, and continuously updated. The basis is our daily work with aerial platforms, telehandlers, and industrial trucks – in rental, sales, operational planning, and technical support.
Each article draws on real-world experience and is editorially reviewed for clarity, accuracy, and practical relevance according to expert criteria. Technical statements are regularly compared against current industry standards and best practices.
The aim of our publications is to make reliable specialist knowledge accessible and to offer guidance to users, decision-makers and industry partners. BIBERGER sees itself as an independent information platform for safe, economical and modern height access technology – well-founded, comprehensible and free from advertising influence.